Here’s a Weather Graph you can print and cut for a simple and quick large group activity. You could use this with a Weather Theme or Winter Theme.
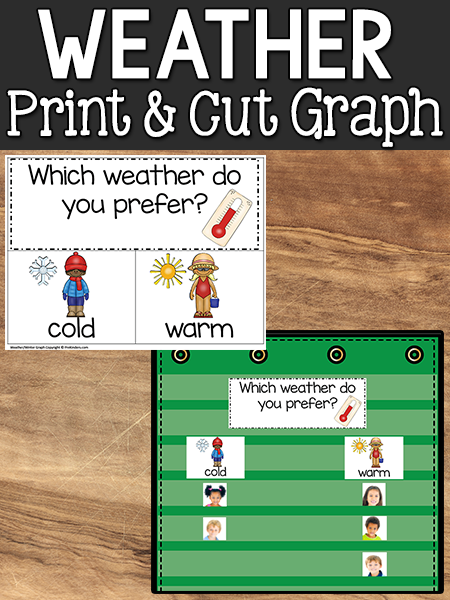
Over the holiday break, I worked on a set of printable graphs that would be easy for teachers to print and prepare. I just printed out this graph, “Which weather do you prefer?” to use with my class this week. Coming back after a long holiday break, it’s nice to have a printable activity that doesn’t take much time to prepare.
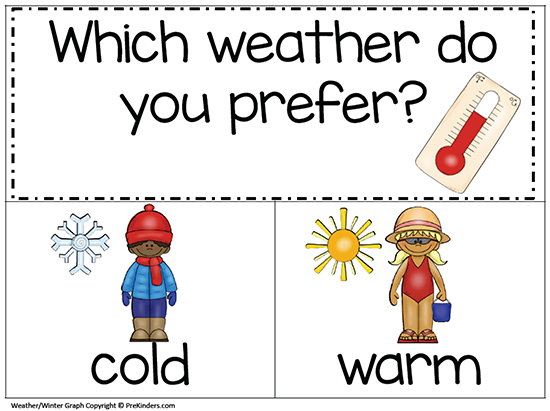
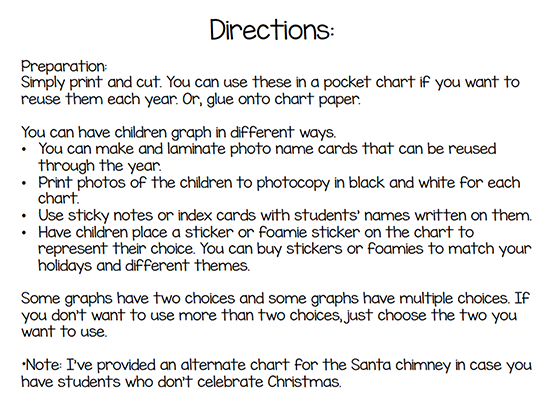
To prepare the graph, all you need to do is download the printable at the link below, print it, cut it, and either use it on chart paper or in a pocket chart. If you want to reuse this each year, you could laminate it and use it in a pocket chart. Or, just attach it to chart paper with glue or tape to have a chart you can post on the classroom wall.
Children can graph their choice by…
- Sticking a sticky note with their name on it on the chart paper graph.
- Placing an index card with their name on it in the pocket chart.
- Sticking a snowflake sticker or foamie sticker on the chart.
- Placing a photo on the chart (print and copy black and white photos on the copy machine).
Download the Weather Print & Cut Graph
Download: Weather Printable Graph
*Note: this printable is FREE. Just click to download.*
Need more printable graphs?
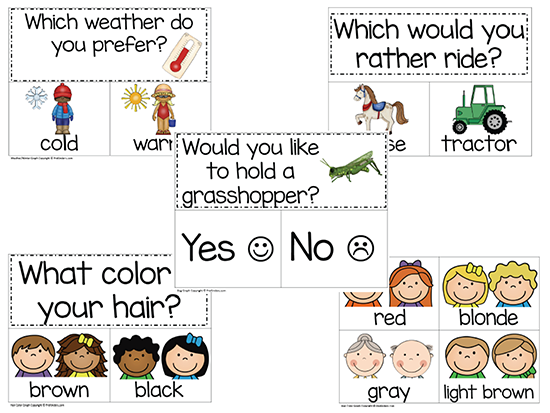
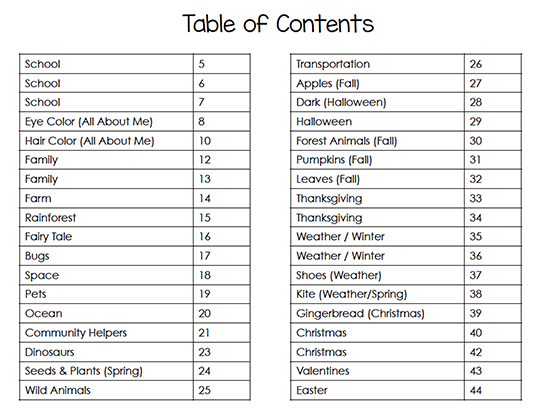
This weather graph is a sample from a larger Graph Kit I posted in my Teachers Pay Teachers shop. There are 36 printable graphs for holidays and themes. If you used one of these graphs each week, it would cover a typical school year. I have other sets of graphs in the works. Here are some examples of the graphs you will find in the pack, including the Table of Contents page and Directions page. To purchase this set, click here: Graph Kit.
